
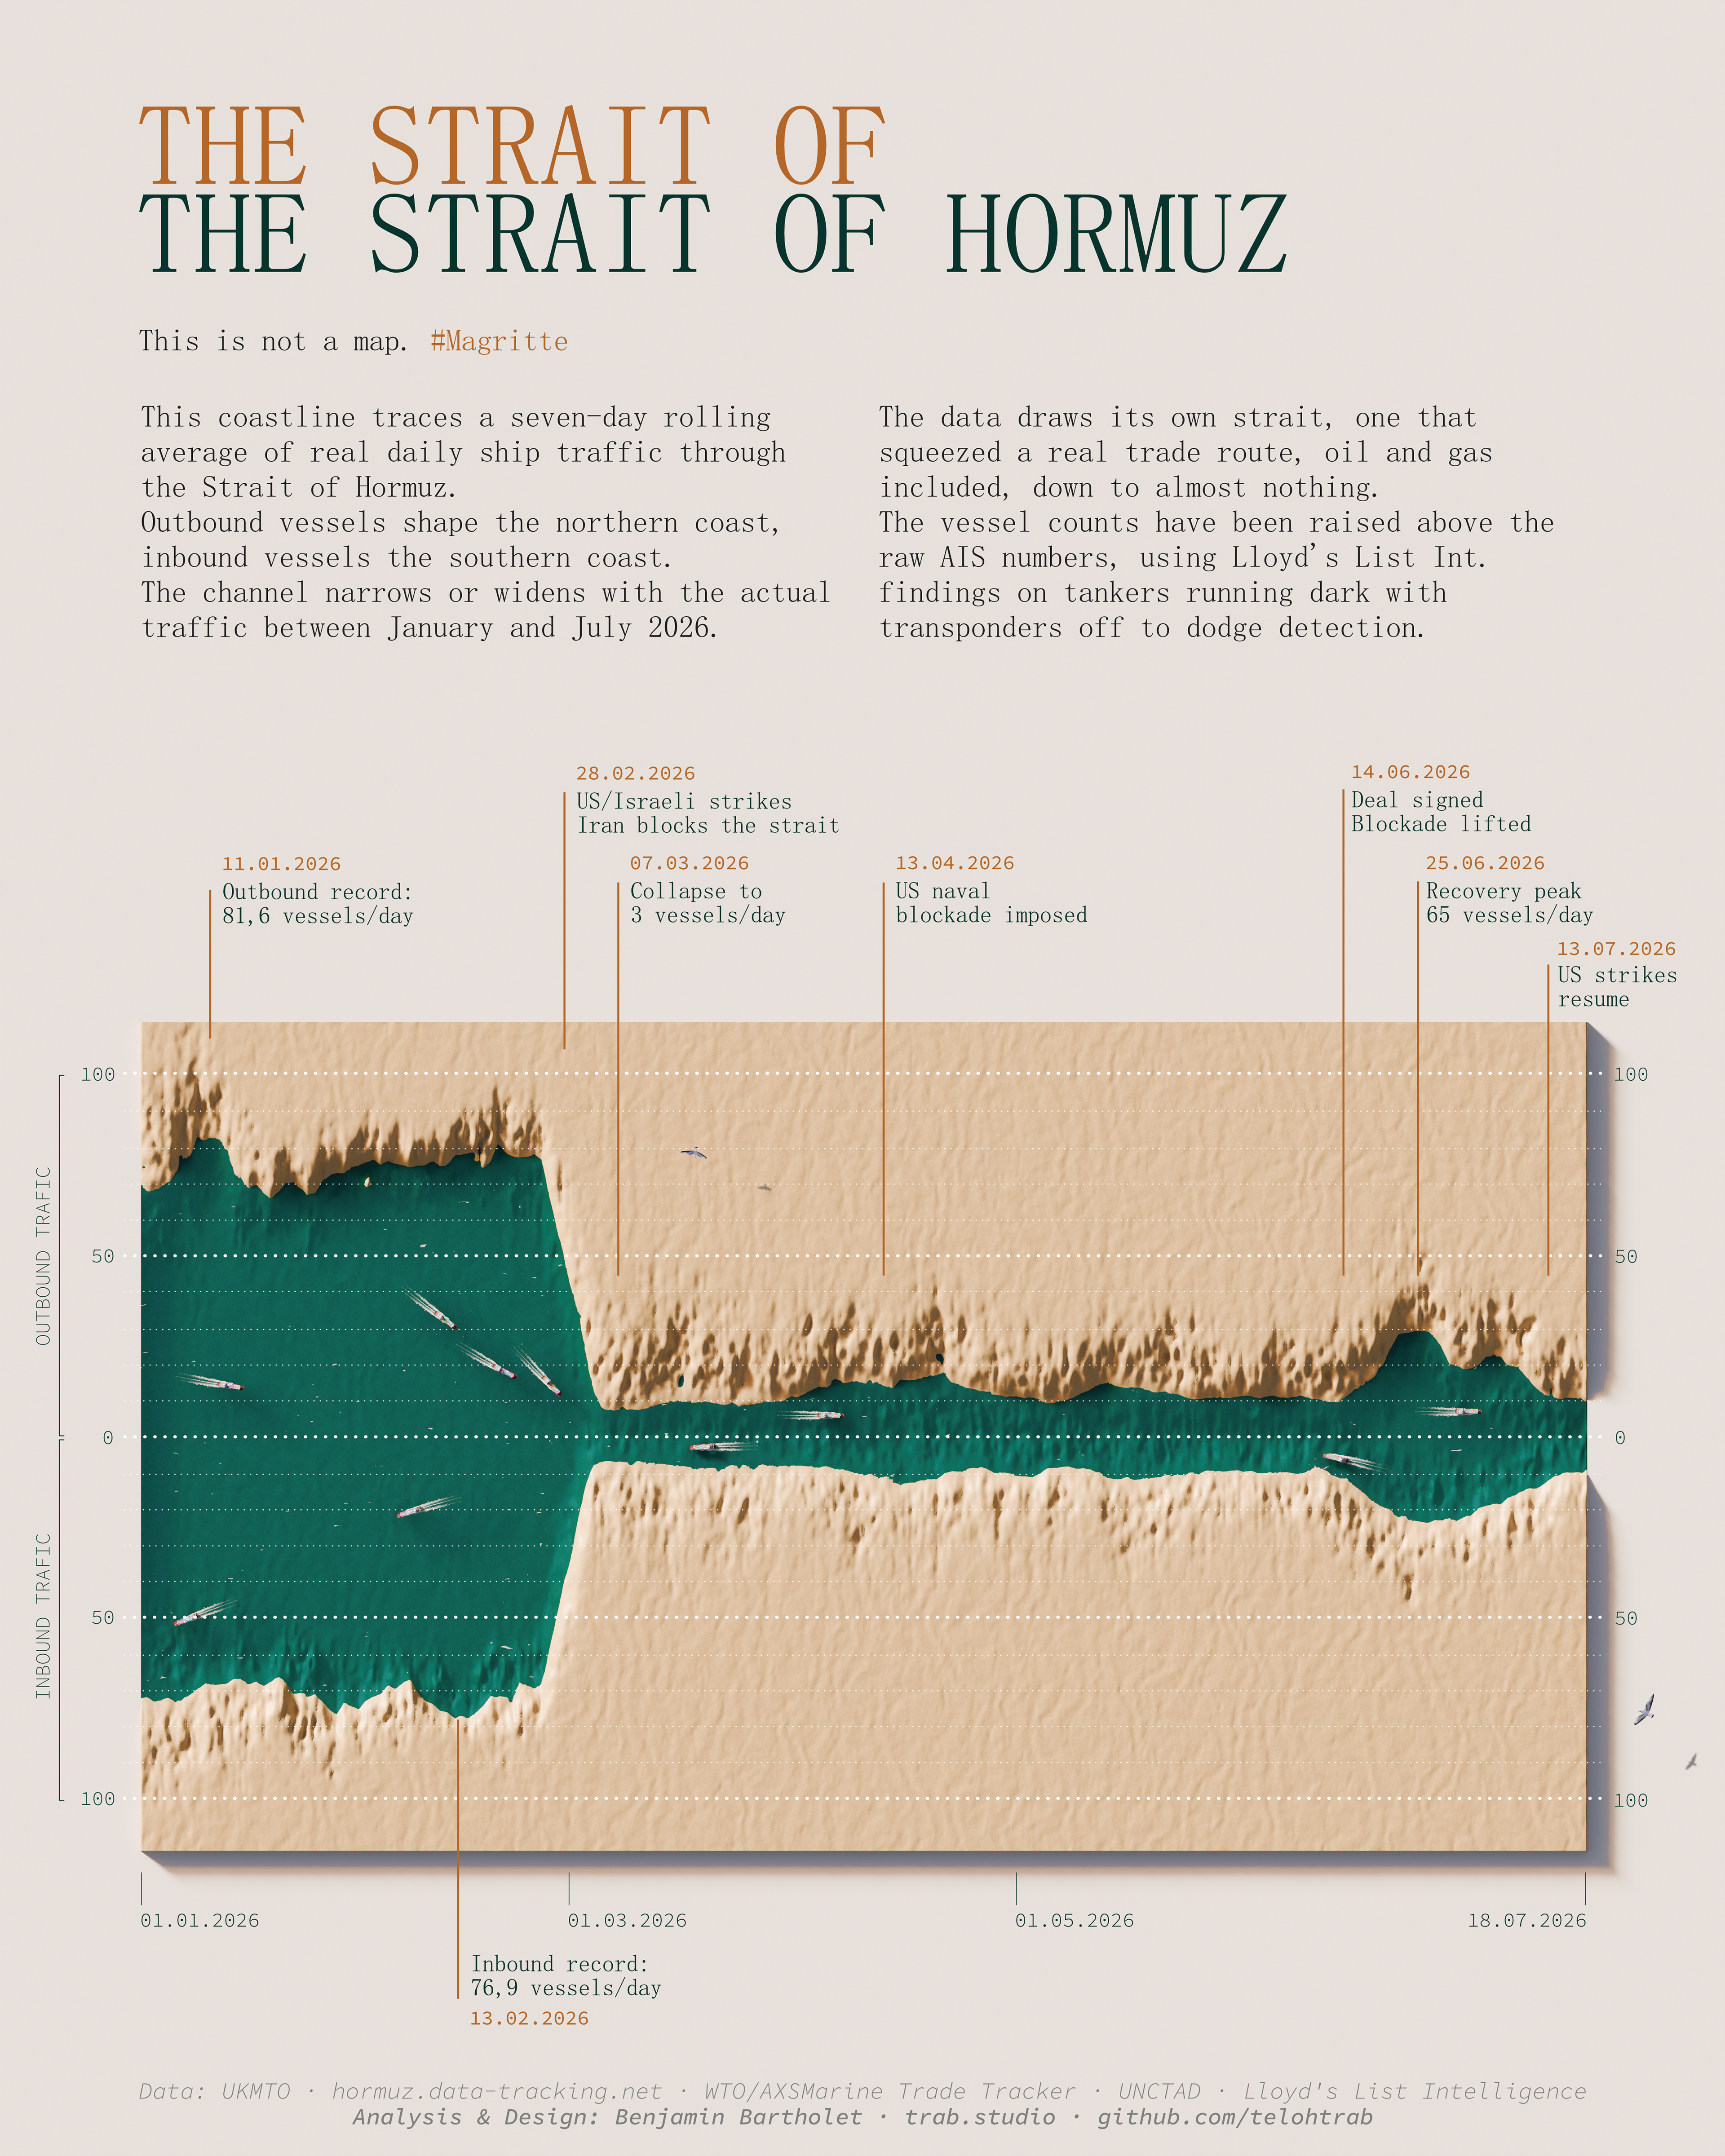
This is not a map. #Magritte
Between January and July 2026, the Strait of Hormuz went through a turbulent stretch, strikes, a blockade, tankers going dark, and the world's busiest oil and gas chokepoint dropping to almost nothing before it slowly reopened.
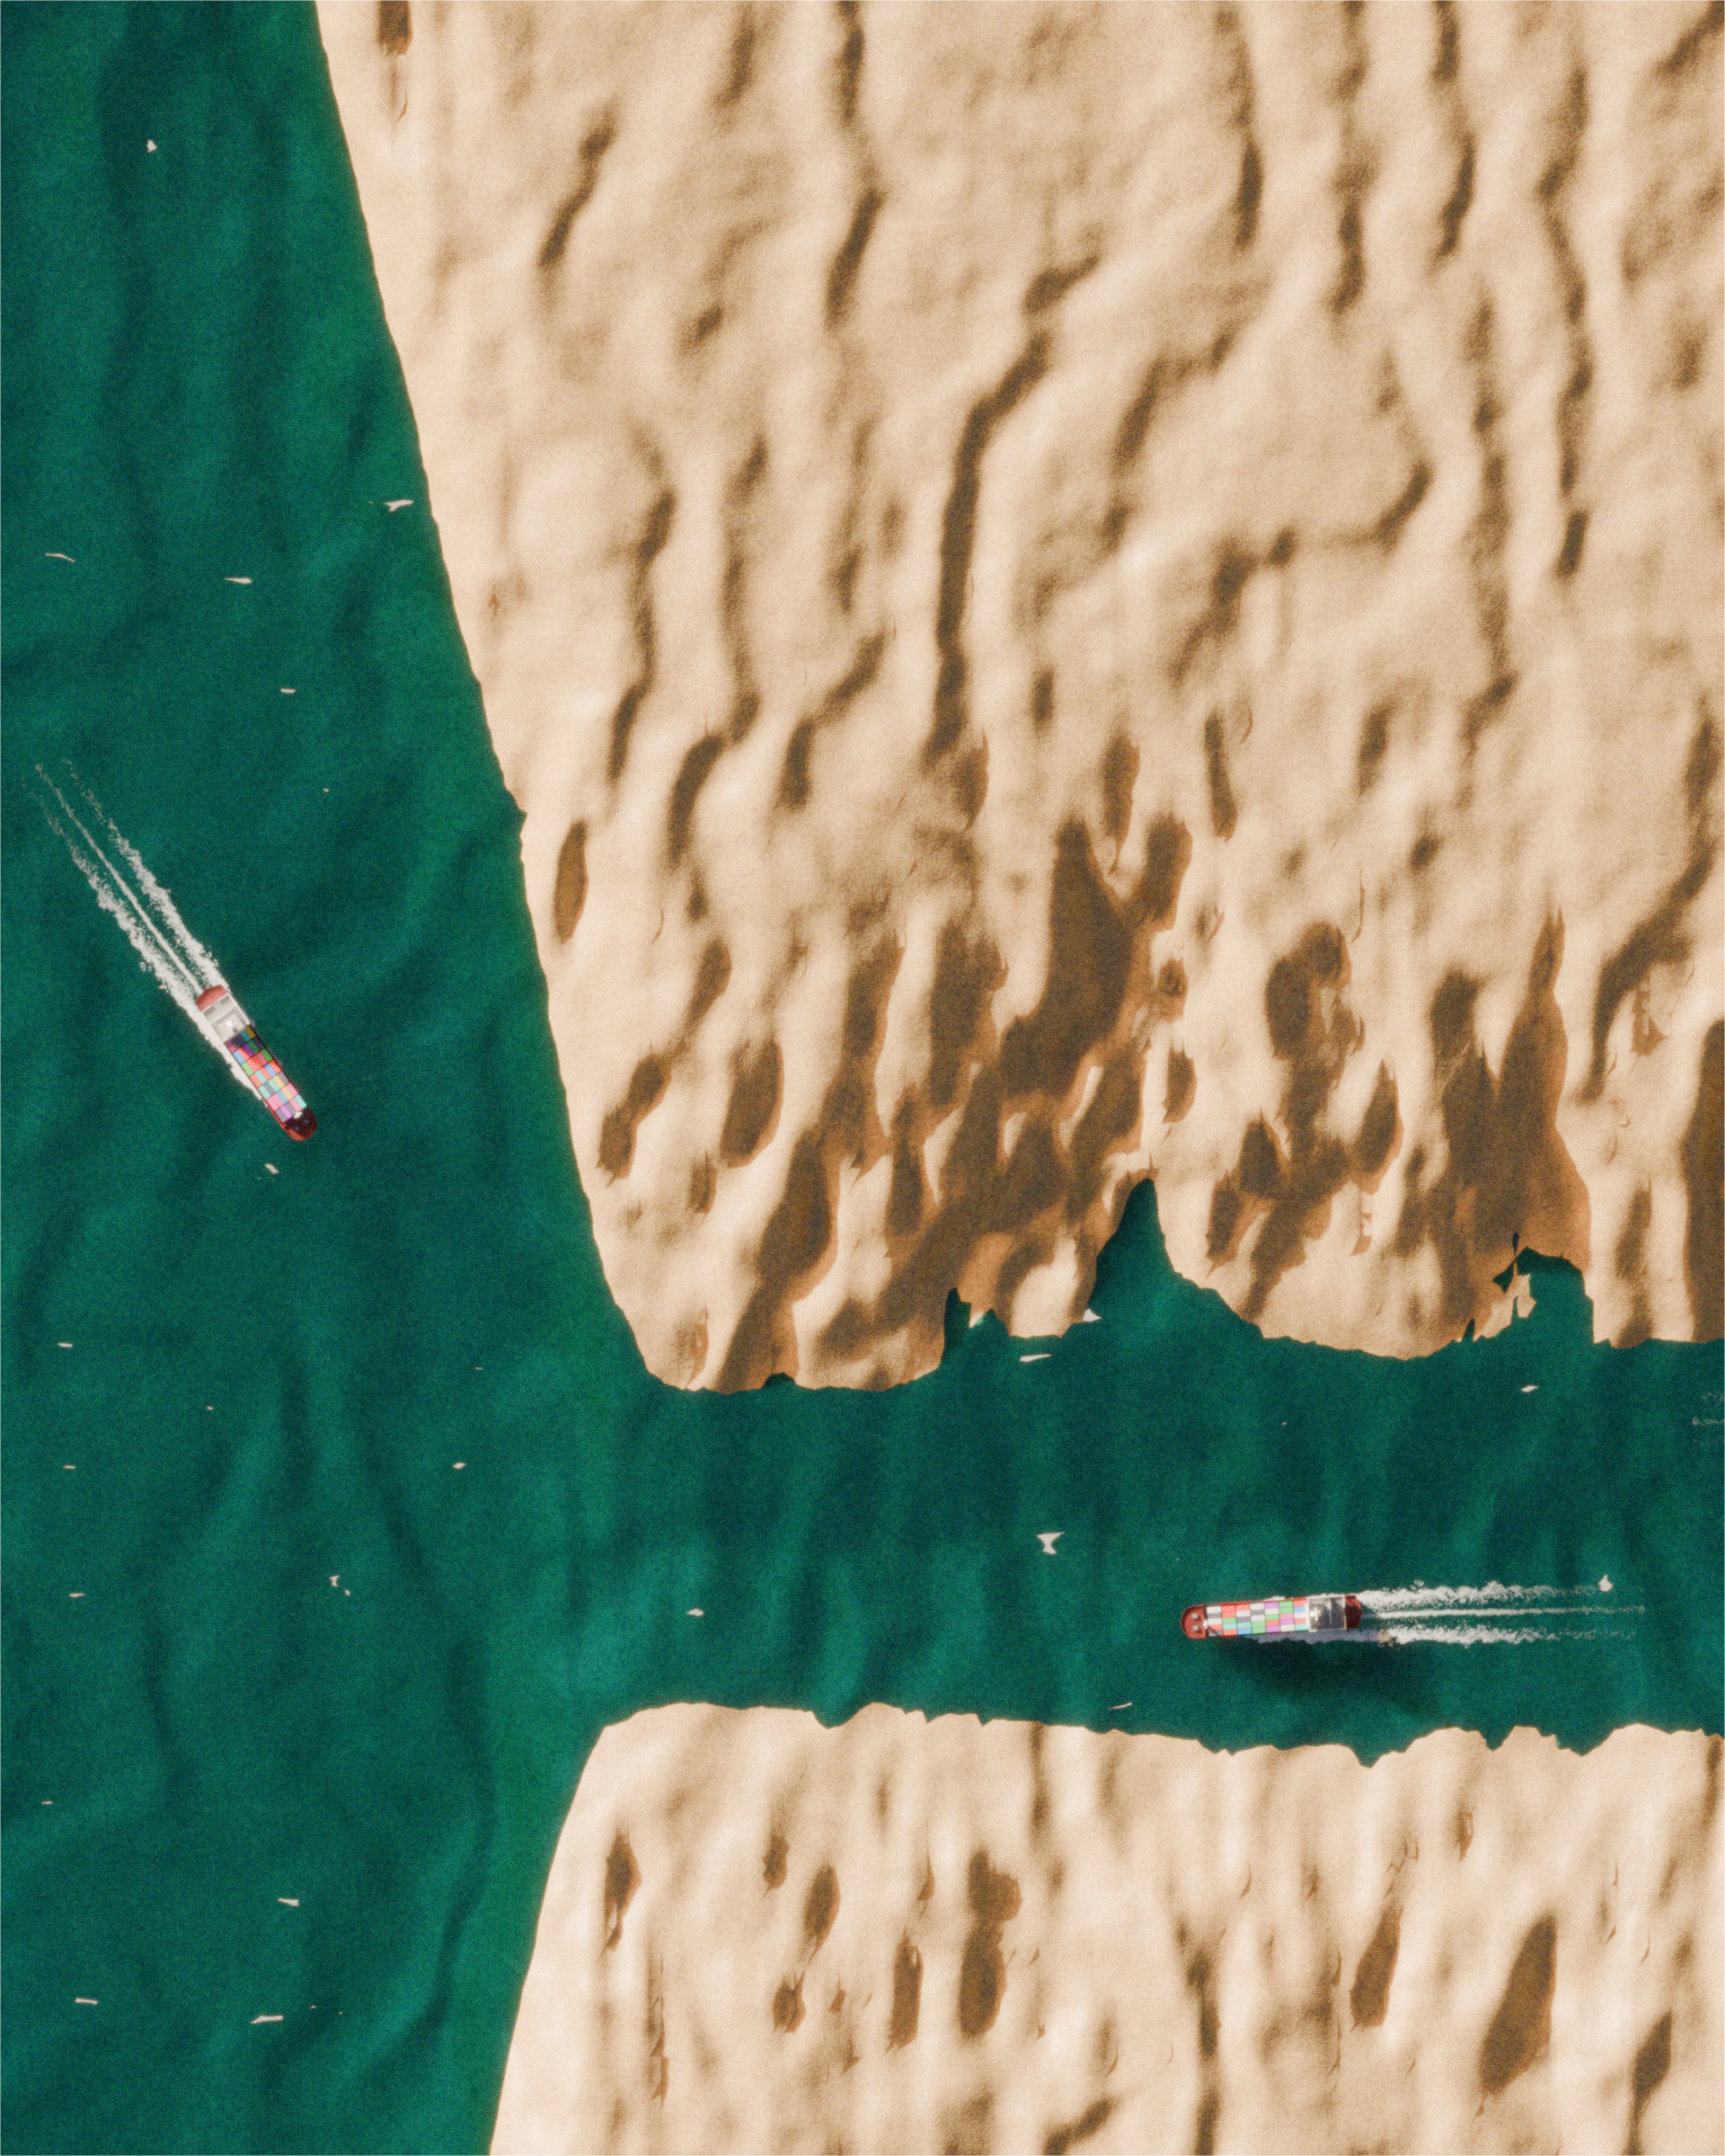
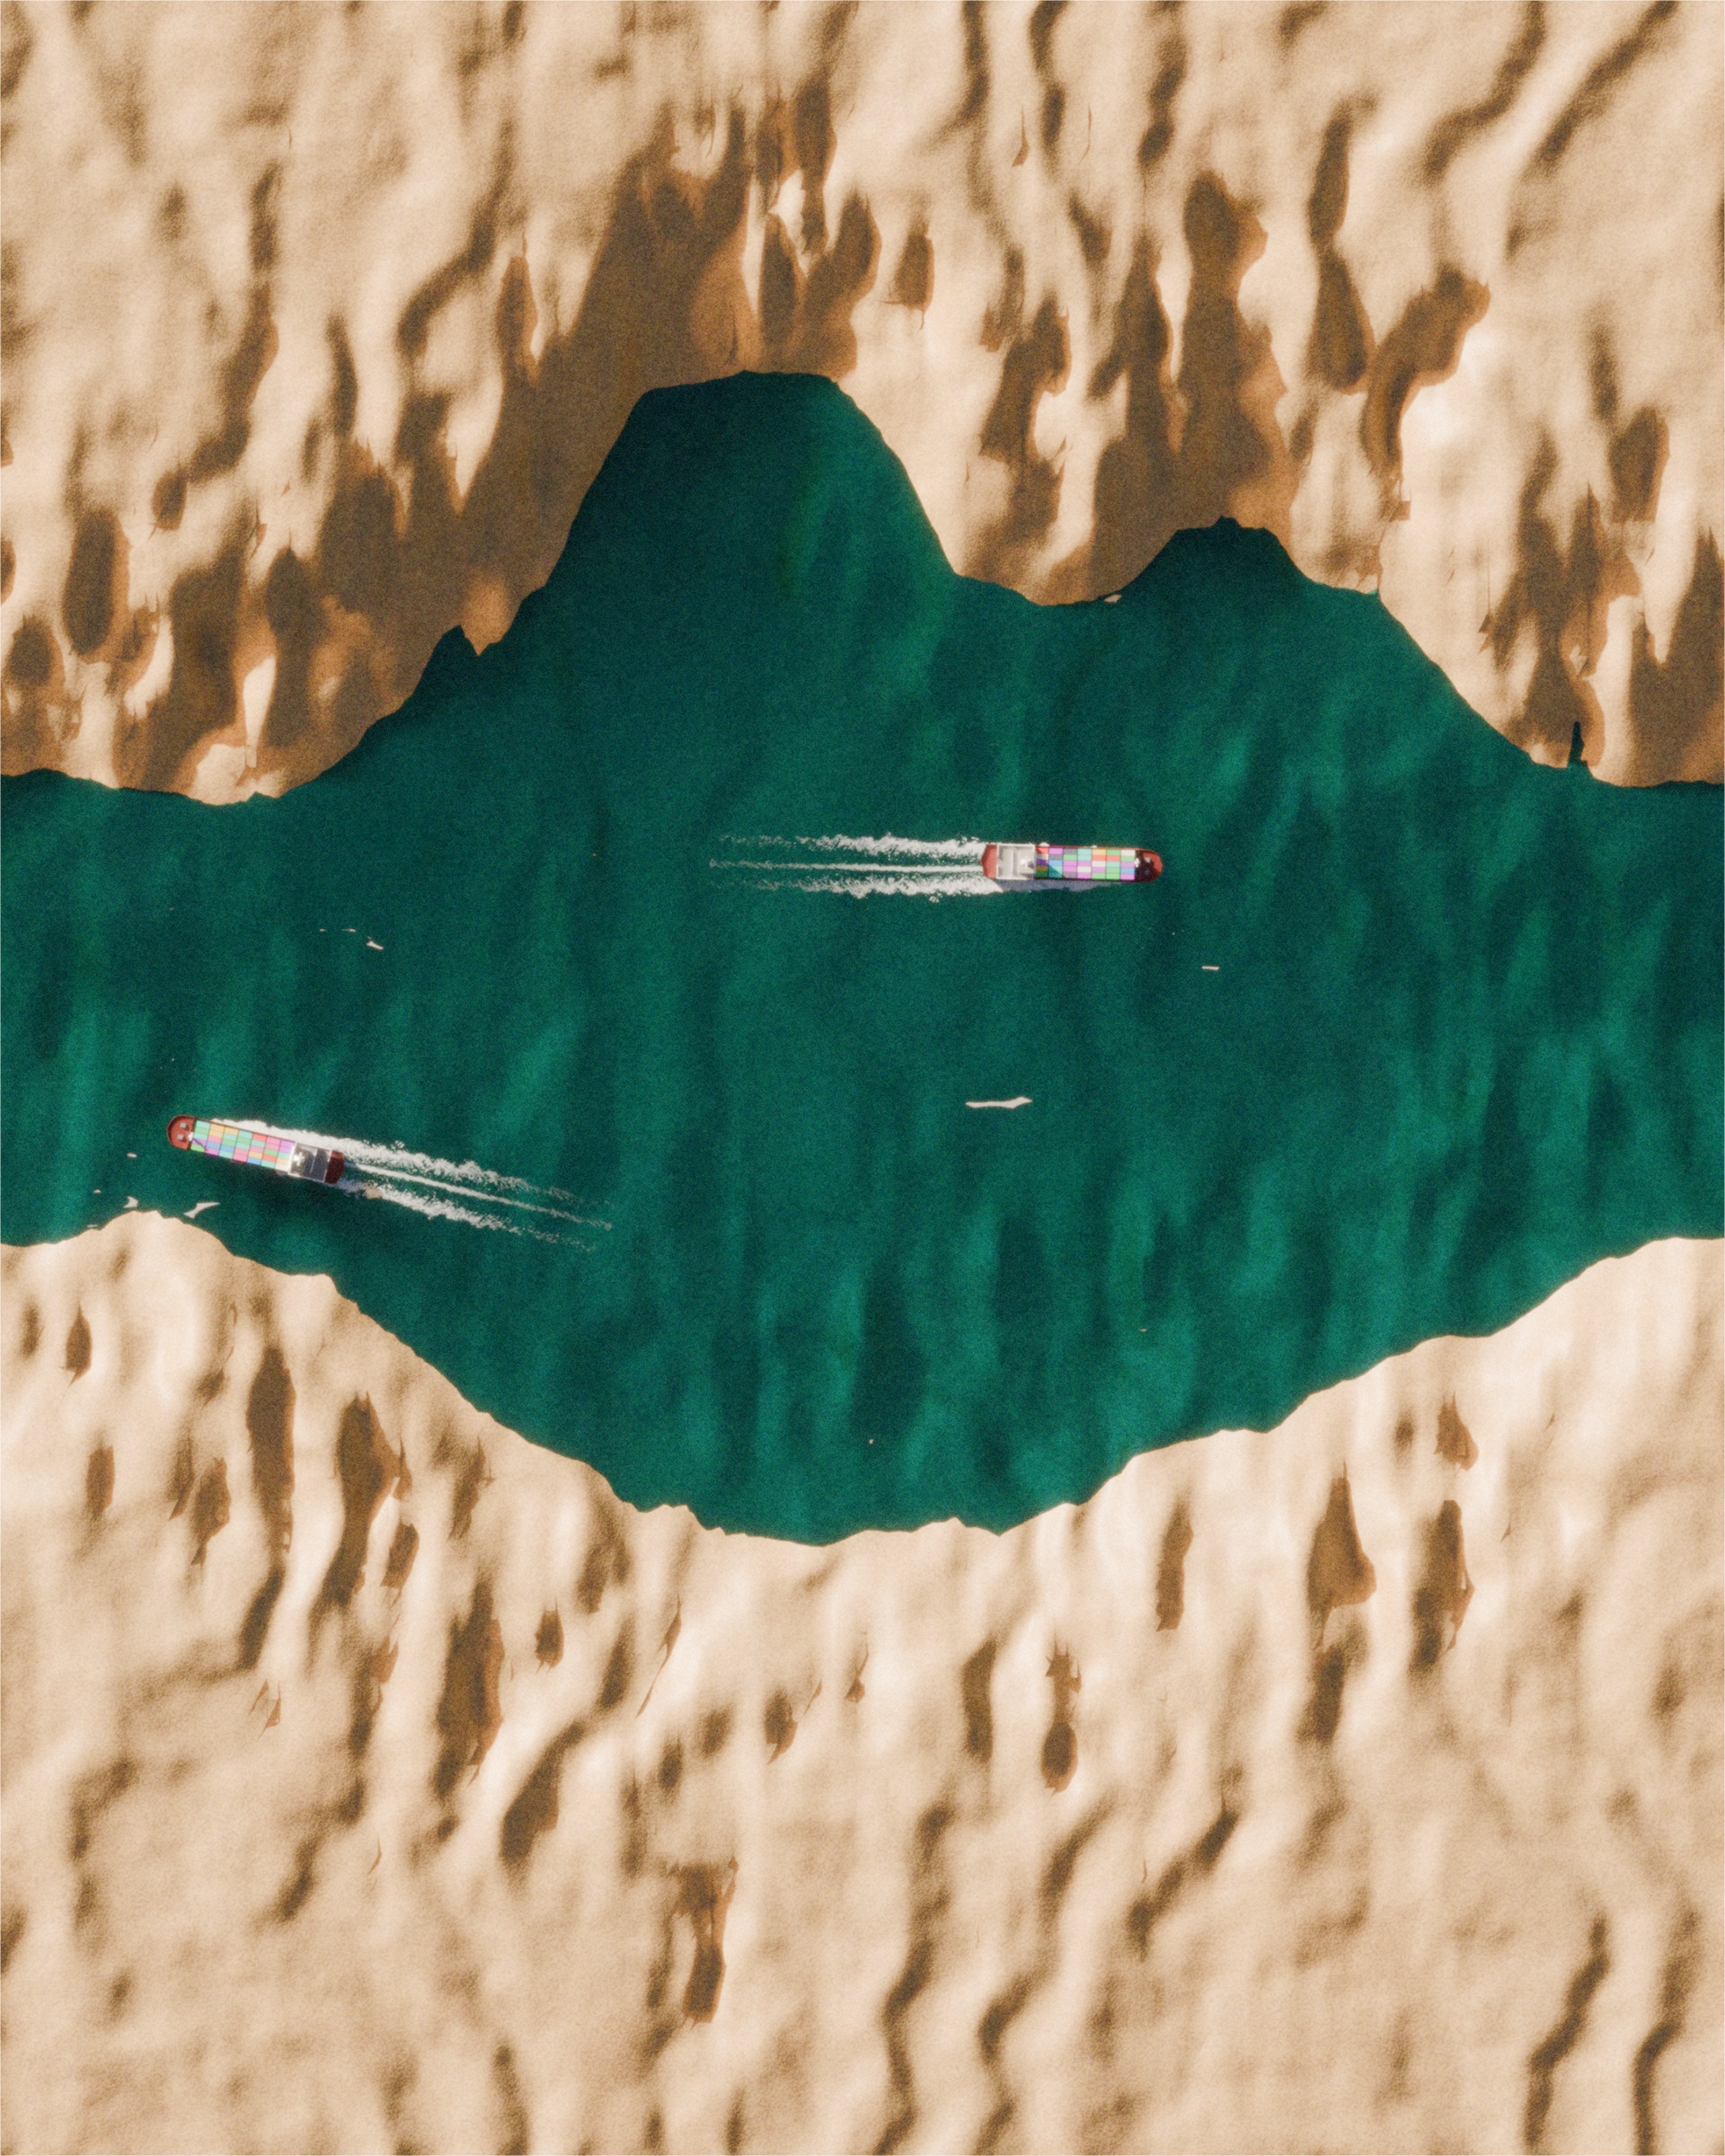
The coastline in this piece isn't drawn by the sea, it's drawn by ships. It draws "the strait of the Strait of Hormuz". Each day of real traffic through the strait bends the shoreline, outbound vessels shaping the northern coast and inbound vessels shaping the southern one, so the channel narrows or widens with the actual traffic.
What I find fitting here is how the form carries the meaning. A chokepoint is a narrow gap that vessels have to queue through, and letting the data draw a real strait made that visible, it tightens when traffic drops, and nearly closes when the blockade hits.
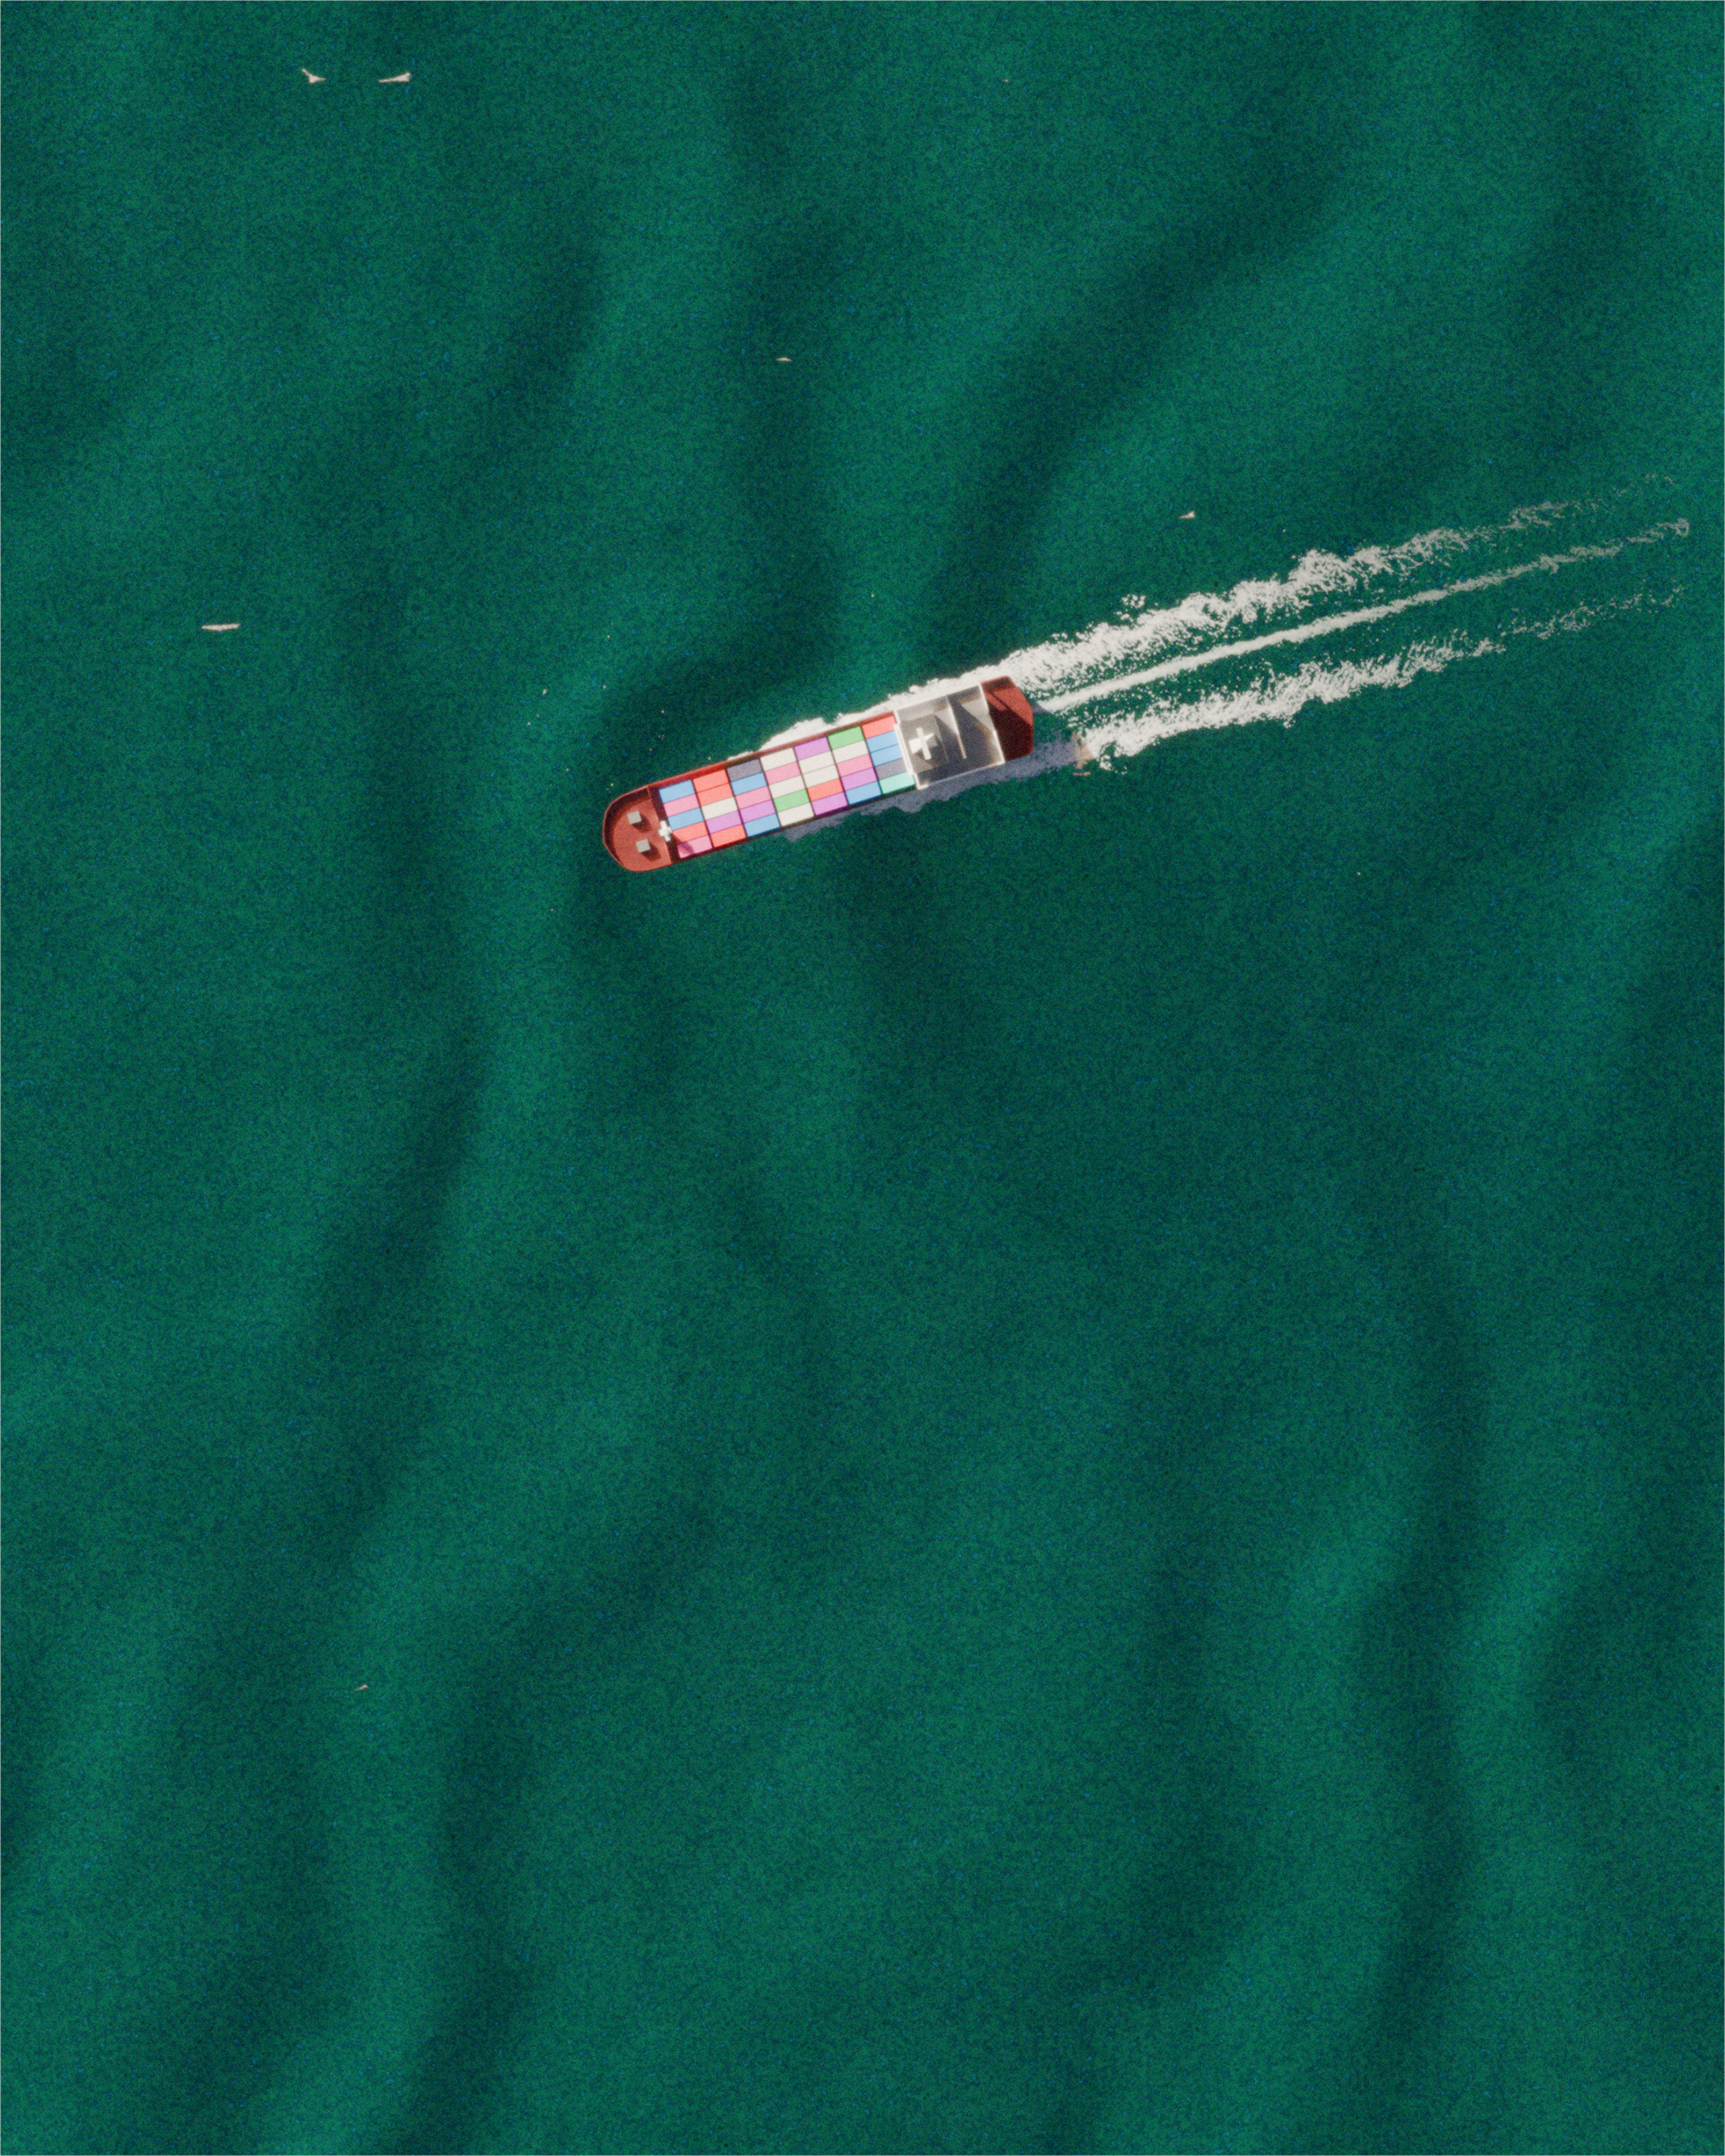
On the making, vessel counts come from AIS data, cross-checked and adjusted upward to account for tankers running dark to dodge detection, thanks to Lloyd's List Intelligence reports and analysis. A Python pipeline turns the transits into coastline geometry and heightmaps, then Blender and Cycles handle the terrain, water and ships rendering.
On the making, vessel counts come from AIS data, cross-checked and adjusted upward to account for tankers running dark to dodge detection, thanks to Lloyd's List Intelligence reports and analysis. A Python pipeline turns the transits into coastline geometry and heightmaps, then Blender and Cycles handle the terrain, water and ships rendering.
It sits somewhere between data visualization, cartography and 3D art.
Year: 2026
Role : Design & Analysis
Data source: AIS, UKMTO, WTO/AXSMarine Trade Tracker, UNCTAD, Lloyd's List Intelligence
Stack: Python, Blender 3D (Cycles)
Code: https://github.com/telohtrab/strait-of-strait
Role : Design & Analysis
Data source: AIS, UKMTO, WTO/AXSMarine Trade Tracker, UNCTAD, Lloyd's List Intelligence
Stack: Python, Blender 3D (Cycles)
Code: https://github.com/telohtrab/strait-of-strait