
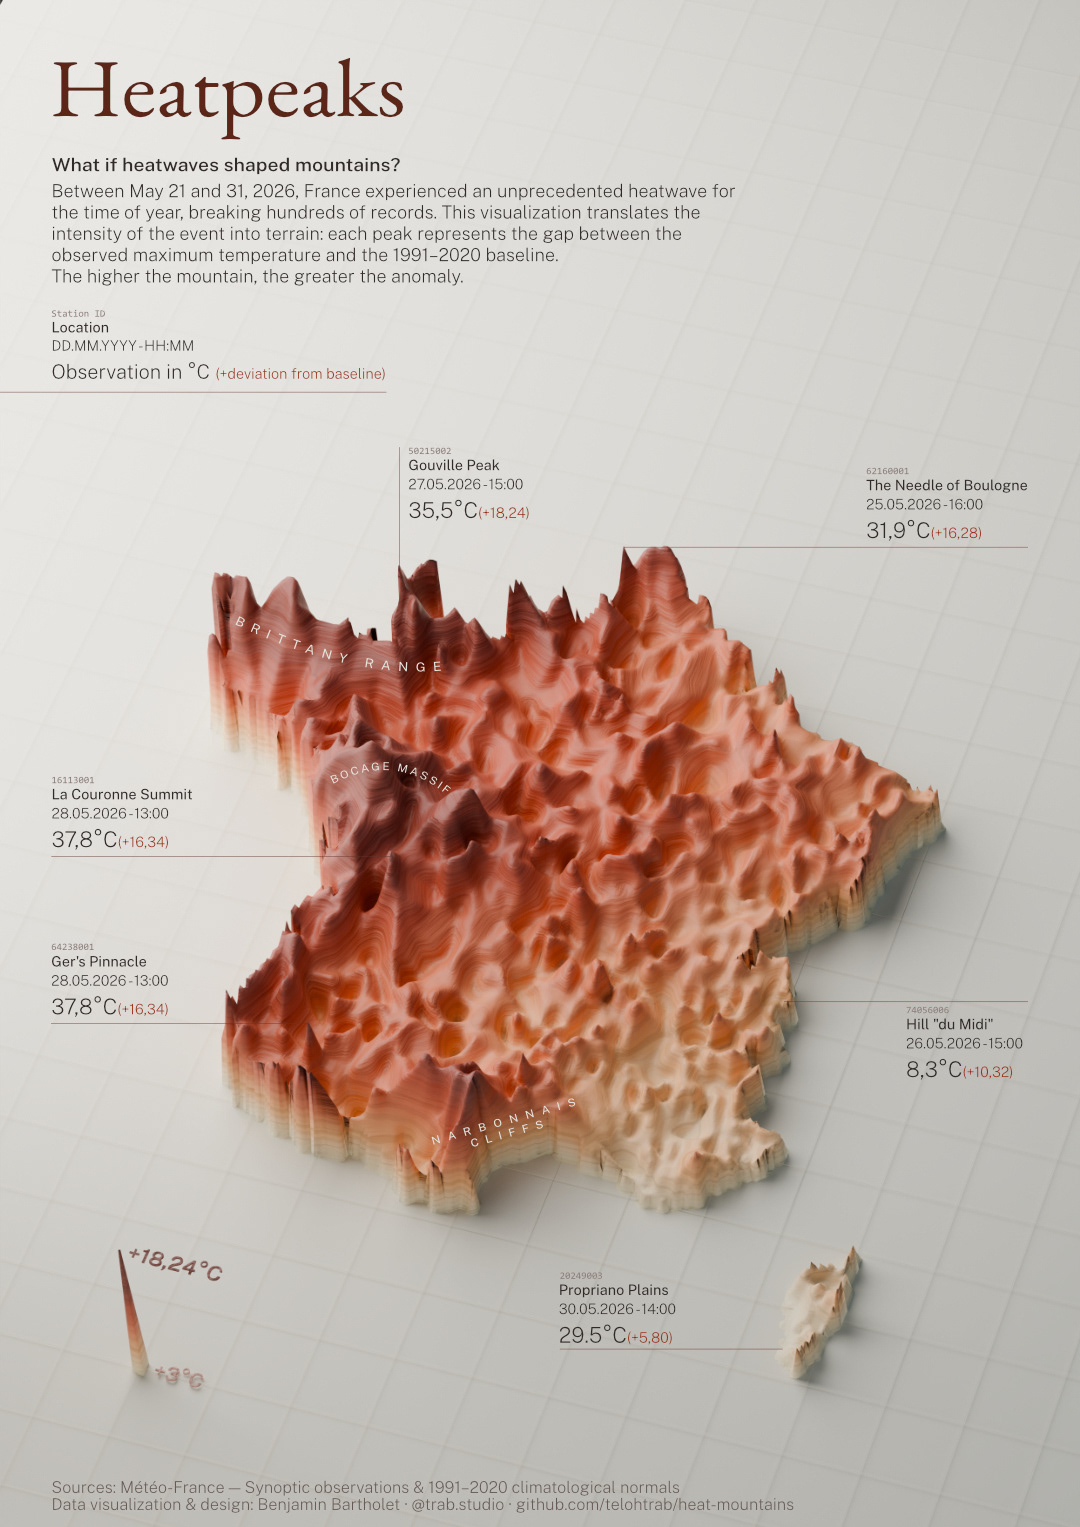
Between May 21 and 31, 2026, France went through an unprecedented heatwave for the time of year, breaking hundreds of records across the country. Heatpeaks is a 3D visualization of that event, built from real weather station data.
The project maps temperature anomalies recorded by Météo-France ground stations against 1991-2020 climatological normals. Rather than picking a single day, a composite temporal maximum was computed across the peak heat period (May 24-28) to capture the full extent of the event as it moved across the country.
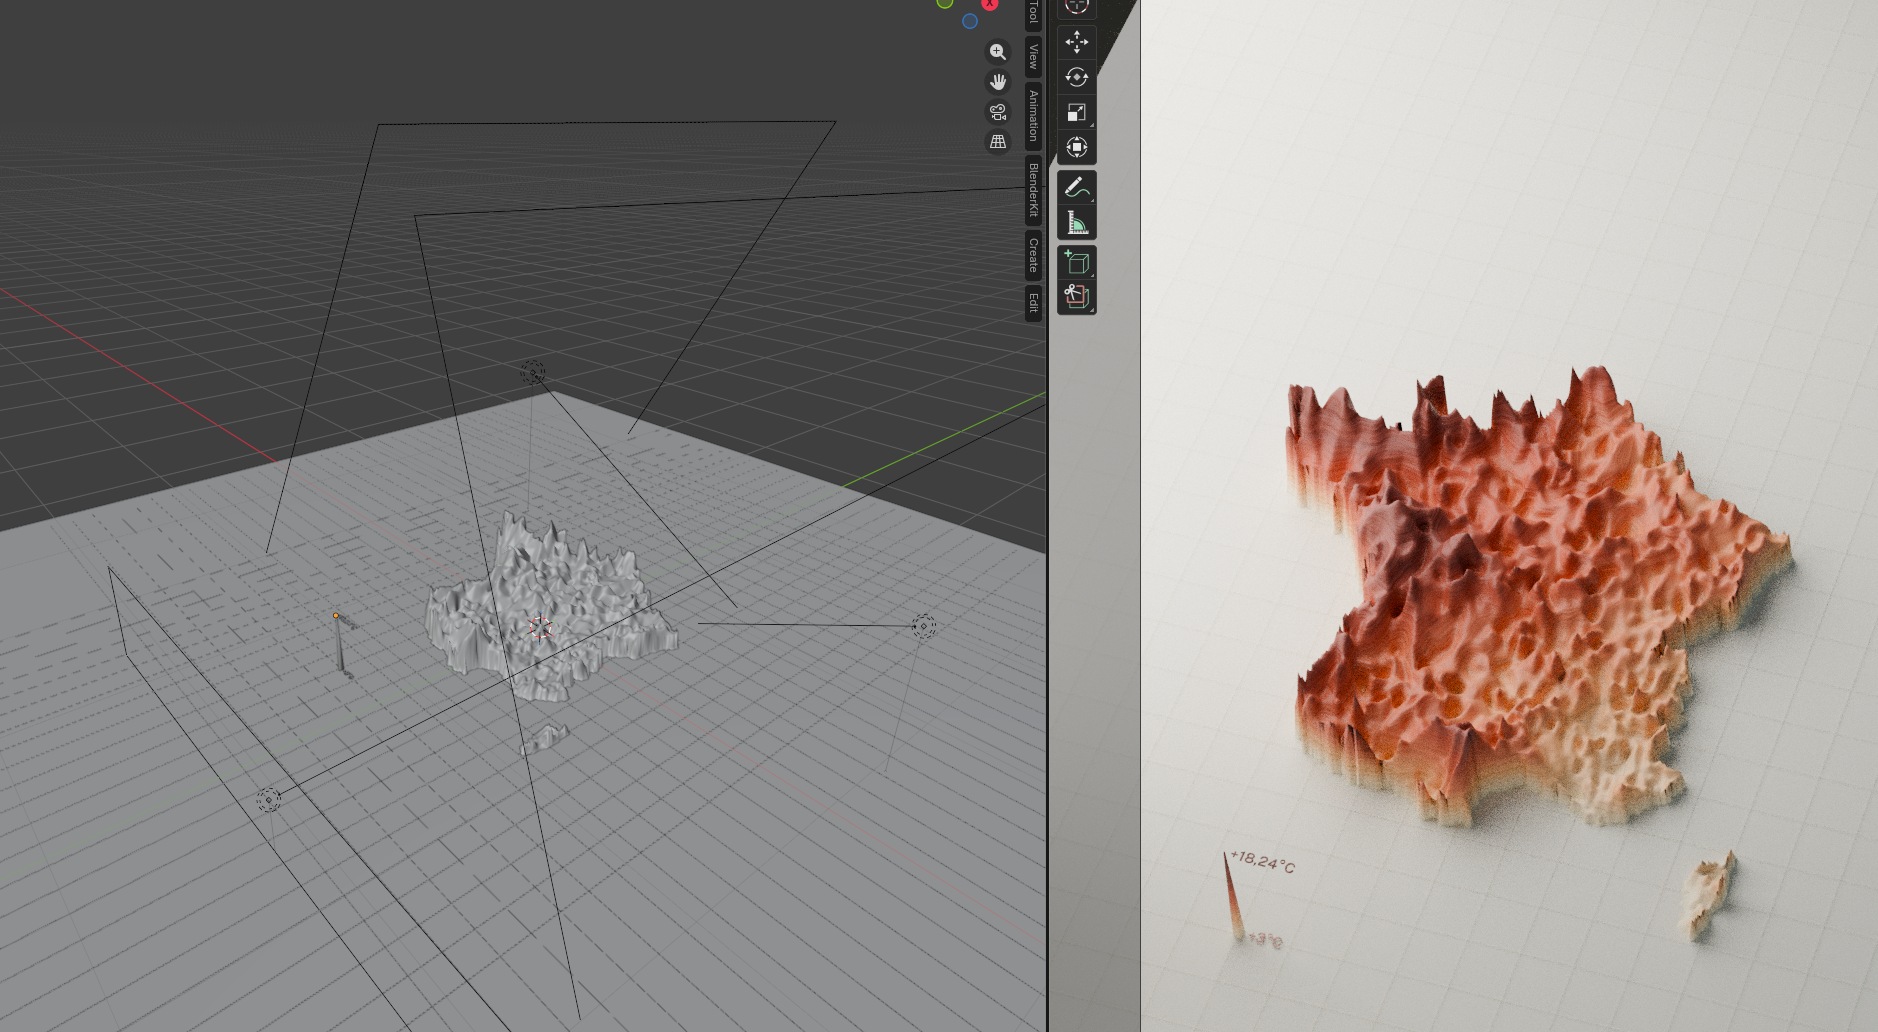
Raw observations from 62 stations were collected through the Météo-France tabular API on data.gouv.fr, cleaned and processed in Python (pandas, scipy), then spatially interpolated to produce a continuous surface. The resulting heightmap was rendered in Blender as a 3D relief where elevation represents temperature anomaly intensity.
Year: 2026
Data source: Météo-France (data.gouv.fr)
Stack: Python, pandas, scipy, matplotlib, Blender 3D, Affinity
Code: https://github.com/telohtrab/heat-mountains/
Data source: Météo-France (data.gouv.fr)
Stack: Python, pandas, scipy, matplotlib, Blender 3D, Affinity
Code: https://github.com/telohtrab/heat-mountains/